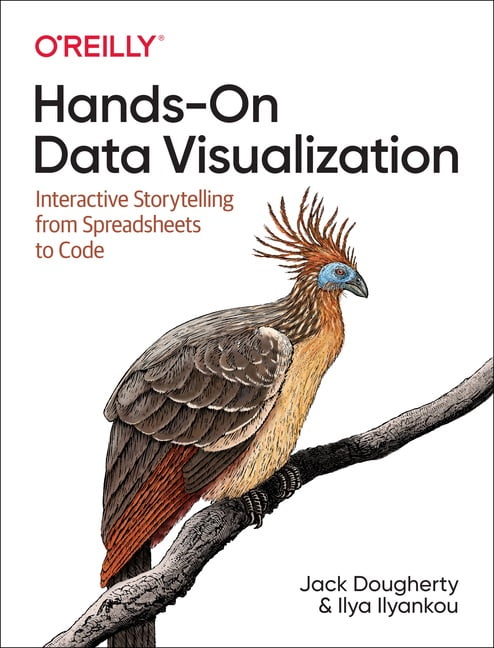
Hands-On Data Visualization. Interactive Storytelling From Spreadsheets to Code 153394
-
ISBN978-1492086000
-
Бренд
-
Автор
-
Рік2021
-
МоваАнглійська
-
ІлюстраціїЧорно-білі
Tell your story and show it with data, using free and easy-to-learn tools on the web. This introductory book teaches you how to design interactive charts and customized maps for your website, beginning with simple drag-and-drop tools such as Google Sheets, Datawrapper, and Tableau Public. You'll also gradually learn how to edit open source code templates like Chart.js, Highcharts, and Leaflet on GitHub.
Hands-On Data Visualization takes you step-by-step through tutorials, real-world examples, and online resources. This practical guide is ideal for students, nonprofit organizations, small business owners, local governments, journalists, academics, and anyone who wants to take data out of spreadsheets and turn it into lively interactive stories. No coding experience is required.
Build interactive charts and maps and embed them in your website
Understand the principles for designing effective charts and maps
Learn key data visualization concepts to help you choose the right tools
Convert and transform tabular and spatial data to tell your data story
Edit and host Chart.js, Highcharts, and Leaflet map code templates on GitHub
Learn how to detect bias in charts and maps produced by others
Щоб скористатися цією функцією, додайте в кошик товарів на суму від 600 грн.
На сторінці оформлення замовлення вкажіть спосіб оплати «Покупка частинами» від вашого банку.
-
Нова ПоштаБезкоштовно від
3'000,00 ₴ -
УкрпоштаБезкоштовно
-
Meest ПоштаБезкоштовно від
3'000,00 ₴
Характеристики
- Бренд
- Автор
- КатегоріяКомп'ютерна література
- Рік2021
- Сторінок480
- Формат170х240 мм
- ОбкладинкаМ'яка
- Тип паперуОфсетний
- МоваАнглійська
- ІлюстраціїЧорно-білі
- Термін поставки25-30 дней
Від видавця
Tell your story and show it with data, using free and easy-to-learn tools on the web. This introductory book teaches you how to design interactive charts and customized maps for your website, beginning with simple drag-and-drop tools such as Google Sheets, Datawrapper, and Tableau Public. You'll also gradually learn how to edit open source code templates like Chart.js, Highcharts, and Leaflet on GitHub.
Hands-On Data Visualization takes you step-by-step through tutorials, real-world examples, and online resources. This practical guide is ideal for students, nonprofit organizations, small business owners, local governments, journalists, academics, and anyone who wants to take data out of spreadsheets and turn it into lively interactive stories. No coding experience is required.
Build interactive charts and maps and embed them in your website
Understand the principles for designing effective charts and maps
Learn key data visualization concepts to help you choose the right tools
Convert and transform tabular and spatial data to tell your data story
Edit and host Chart.js, Highcharts, and Leaflet map code templates on GitHub
Learn how to detect bias in charts and maps produced by others












Відгуки про Hands-On Data Visualization. Interactive Storytelling From Spreadsheets to Code