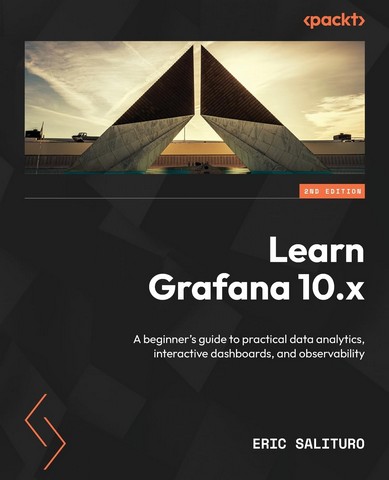
Learn Grafana 10.x - Second Edition: A beginner's guide to practical data analytics, interactive dashboards, and observability 2nd ed. Edition 286397
Код товару: 286397Паперова книга
-
ISBN978-1803231082
-
Бренд
-
Автор
-
Рік2023
-
МоваАнглійська
-
ІлюстраціїЧорно-білі
Get up and running with building data pipelines and creating interactive dashboards to visualize, monitor, and present a wide variety of time-series data with this comprehensive introductory guide
Key Features
- Install, set up, and configure Grafana for real-time data analysis, visualization, and alerting
- Visualize and monitor data using data sources such as InfluxDB, Telegraf, Prometheus, and Elasticsearch
- Explore Grafana's cloud support with Microsoft Azure, Amazon CloudWatch, and Google Cloud Monitoring
Book Description
Get ready to unlock the full potential of the open-source Grafana observability platform, ideal for analyzing and monitoring time-series data with this updated second edition. This beginners guide will help you get up to speed with Grafana's latest features for querying, visualizing, and exploring logs and metrics, no matter where they are stored.
Starting with the basics, this book demonstrates how to quickly install and set up a Grafana server using Docker. You'll then be introduced to the main components of the Grafana interface before learning how to analyze and visualize data from sources such as InfluxDB, Telegraf, Prometheus, Logstash, and Elasticsearch. The book extensively covers key panel visualizations in Grafana, including Time Series, Stat, Table, Bar Gauge, and Text, and guides you in using Python to pipeline data, transformations to facilitate analytics, and templating to build dynamic dashboards. Exploring real-time data streaming with Telegraf, Promtail, and Loki, you'll work with observability features like alerting rules and integration with PagerDuty and Slack. As you progress, the book addresses the administrative aspects of Grafana, from configuring users and organizations to implementing user authentication with Okta and LDAP, as well as organizing dashboards into folders, and more.
By the end of this book, you'll have gained all the knowledge you need to start building interactive dashboards.
What you will learn
- Learn the techniques of data visualization using Grafana
- Get familiar with the major components of Time series visualization
- Explore data transformation operations, query inspector, and time interval settings
- Work with advanced dashboard features, such as annotations, variable-based templating, and dashboard linking and sharing
- Connect user authentication through Okta, Google, GitHub, and other external providers
- Discover Grafana's monitoring support for cloud service infrastructures
Who this book is for
This book is for business intelligence developers, business analysts, data analysts, and anyone interested in performing time-series data analysis and monitoring using Grafana. You'll also find this book useful if you're looking to create and share interactive dashboards or get up to speed with the latest features of Grafana. Although no prior knowledge of Grafana is required, basic knowledge of data visualization and some Python programming experience will help you understand the concepts covered in the book.
About the Author
Eric Salituro is currently a Software Engineering Manger with the Enterprise Data and Analytics Platform team at Zendesk. He has an IT career spanning over 30 years, over 20 of which were in the motion picture industry working as a pipeline technical director and software developer for innovative and creative studios like DreamWorks, Digital Domain, and Pixar. Before moving to Zendesk, he worked at Pixar helping to manage and maintain their production render farm as a Senior Software Developer. Among his accomplishments there was the development of a Python API toolkit for Grafana aimed at streamlining the creation of rendering metrics dashboards
1'700 ₴
Купити
Відправимо післязавтра
Monobank
от 191 ₴ / міс.
до 10 платежей
Покупка частинами Monobank
₴ / місяць
Для використання функції «Покупка частинами» необхідно мати картку Monobank.
Розділивши оплату на певну кількість платежів (від 3 до 10),
ви платите лише одну частину. Решта – раз на місяць списуватиметься з вашої карти.
Послуга може бути використана при замовлення на суму від 600 грн.
Увага! При покупці частинами знижки на товари не враховуються.
Щоб скористатися цією функцією, додайте в кошик товарів на суму від 600 грн.
На сторінці оформлення замовлення вкажіть спосіб оплати «Покупка частинами Monobank». Підтвердьте покупку у програмі Monobank.
-
Нова ПоштаБезкоштовно від
3'000,00 ₴ -
УкрпоштаБезкоштовно
-
Meest ПоштаБезкоштовно від
3'000,00 ₴
Характеристики
- Бренд
- Автор
- КатегоріяПрограмування
- Номер видання2-ге вид.
- Рік2023
- Сторінок542
- Формат190х235 мм
- ОбкладинкаМ'яка
- Тип паперуОфсетний
- МоваАнглійська
- ІлюстраціїЧорно-білі
Від видавця
Get up and running with building data pipelines and creating interactive dashboards to visualize, monitor, and present a wide variety of time-series data with this comprehensive introductory guide
Key Features
- Install, set up, and configure Grafana for real-time data analysis, visualization, and alerting
- Visualize and monitor data using data sources such as InfluxDB, Telegraf, Prometheus, and Elasticsearch
- Explore Grafana's cloud support with Microsoft Azure, Amazon CloudWatch, and Google Cloud Monitoring
Book Description
Get ready to unlock the full potential of the open-source Grafana observability platform, ideal for analyzing and monitoring time-series data with this updated second edition. This beginners guide will help you get up to speed with Grafana's latest features for querying, visualizing, and exploring logs and metrics, no matter where they are stored.
Starting with the basics, this book demonstrates how to quickly install and set up a Grafana server using Docker. You'll then be introduced to the main components of the Grafana interface before learning how to analyze and visualize data from sources such as InfluxDB, Telegraf, Prometheus, Logstash, and Elasticsearch. The book extensively covers key panel visualizations in Grafana, including Time Series, Stat, Table, Bar Gauge, and Text, and guides you in using Python to pipeline data, transformations to facilitate analytics, and templating to build dynamic dashboards. Exploring real-time data streaming with Telegraf, Promtail, and Loki, you'll work with observability features like alerting rules and integration with PagerDuty and Slack. As you progress, the book addresses the administrative aspects of Grafana, from configuring users and organizations to implementing user authentication with Okta and LDAP, as well as organizing dashboards into folders, and more.
By the end of this book, you'll have gained all the knowledge you need to start building interactive dashboards.
What you will learn
- Learn the techniques of data visualization using Grafana
- Get familiar with the major components of Time series visualization
- Explore data transformation operations, query inspector, and time interval settings
- Work with advanced dashboard features, such as annotations, variable-based templating, and dashboard linking and sharing
- Connect user authentication through Okta, Google, GitHub, and other external providers
- Discover Grafana's monitoring support for cloud service infrastructures
Who this book is for
This book is for business intelligence developers, business analysts, data analysts, and anyone interested in performing time-series data analysis and monitoring using Grafana. You'll also find this book useful if you're looking to create and share interactive dashboards or get up to speed with the latest features of Grafana. Although no prior knowledge of Grafana is required, basic knowledge of data visualization and some Python programming experience will help you understand the concepts covered in the book.
About the Author
Eric Salituro is currently a Software Engineering Manger with the Enterprise Data and Analytics Platform team at Zendesk. He has an IT career spanning over 30 years, over 20 of which were in the motion picture industry working as a pipeline technical director and software developer for innovative and creative studios like DreamWorks, Digital Domain, and Pixar. Before moving to Zendesk, he worked at Pixar helping to manage and maintain their production render farm as a Senior Software Developer. Among his accomplishments there was the development of a Python API toolkit for Grafana aimed at streamlining the creation of rendering metrics dashboards
Зміст
Table of Contents
- Introducing Data Visualization with Grafana
- Touring the Grafana Interface
- Diving into Grafana's Time Series Visualization
- Connecting Grafana to a Prometheus Data Source
- Extracting and Visualizing Data with InfluxDB and Grafana
- Shaping Data with Grafana Transformations
- Surveying Key Grafana Visualizations
- Surveying Additional Grafana Visualizations
- Creating Insightful Dashboards
- Working with Advanced Dashboard Features and Elasticsearch

Learn Grafana 10.x - Second Edition: A beginner's guide to practical data analytics, interactive dashboards, and observability 2nd ed. Edition
1'700 ₴




















Відгуки про Learn Grafana 10.x - Second Edition: A beginner's guide to practical data analytics, interactive dashboards, and observability 2nd ed. Edition